Sally Kang
why join the navy.
Passive Activity Classification of Smart Homes through Wireless Packet Sniffing
This post is to sum up my capstone project for the last semester of my postgraduate. Due to the COV-19 pandemic, I have to study remotely the whole semester, which might also be the possible reason that I have been less productive in the past six months. Well then, just a little record here.
Motivations of This Project
As the title tells, the main reason I chose this project is to have more understanding of IoT security. Actually, it is believed that increasing popularity of IoT devices raises security concerns.
In the real-world scenario of most devices connected via WiFi networks, despite that related exchanged information is masked using encryption protocols like WPA2 protocol, sensitive meta-data (e.g., packet lengths, traffic rate) of the network traffic can still be leaked during the transmission, which can result in vulnerabilities such as side-channel attacks.
Thus, we are motivated to take a deep look into sensitive information exposure from smart devices such as device activities detection through WiFi side-channels using machine learning techniques.
Our Objectives
- Collect a sufficient amount of data of IoT devices: Using various types of smart devices to set up an ideal environment to collect their data over the Wifi network.
- Data cleaning and Processing: Clean the collected data and create pickle (such as average number of packets in iterations) data in order to train machine learning models.
- Training the Architecture: Train CNN model with pickle data to identify smart devices.
- Evaluate the outcome of the experiment: Check the outcome of CNN model to make improvement
- Make feasible improvements: Adjust CNN model to equip with our pickle data to increase accuracy
- Collect concept drift data: Collect more data for better performance.
Related Work
Previous work
- Abbas Acar et al, 2018, “Peek-a-Boo: I see your smart home activities, even
encrypted!”
- Propose a way to infer ongoing user activities in a smart home
- Payap Sirinam et al, 2018, “Deep Fingerprinting: Undermining Website Fingerprinting
Defenses with Deep Learning”
- Propose the Deep Fingerprinting (DF) model based on a Convolutional Neural Network (CNN) for identifying encrypted network traffic.
Our work
- Combine these work above for passive activity classification of smart homes through wireless packet sniffing.
Data – How We Captured And Why
The major activities involved in accomplishing this task are capturing sufficient amounts of data, performing data cleansing and using deep learning techniques to classify data instances into predefined activity classes. Further, the data capturing process has been bifurcated into three categories – capture first iteration of 1000 traces of each category and start training the existing deep learning model on this data, run further iterations of 1000 traces every week towards concept-drift datasets and plan some sequence of multiple activities depicting a real-life scenario followed by capturing data for these sequences.
In our work, we mainly focus on the deep learning techniques that previous work has shown to be promising for network traffic identification. We first remove any packets with “badFCS” flags as these are corrupted packets, then we process data by extracting packet lengths and polarity for each packet using Python scripts, here the term “polarity” means the direction of traffic, which could be incoming (from the router to the smart device) or outgoing (from the smart device to the router). Each packet in captured traces (pcap file) is converted as in following format:
- pkt = [(direction)packet length], where the direction is 1(-1) if it is an incoming (outgoing) packet.
Deep Fingerprinting facilitates an attacker to understand the usage pattern in a certain setup. Though the data transfer to/from IoT devices is encrypted and highly secure, yet the signature of devices itself reveal much about the user(s). For instance, the type of device clubbed with its usage timing pattern could help establish presence/absence of the user within the setting. Hence, Deep Fingerprinting turns out to be our preferred choice in classifying attack vectors.
Convolutional neural networks have a unique ability to retain spatial information through filter kernels. Moreover, the salient features extracted by convolutional kernels are translation invariant. As we understand the limitations of CNN with regards to the amount of data required, we make our best efforts to capture data in bulk and evaluate model performance by using all data together as well as using data from different days to evaluate the model performance in a chronological arrangement.
We concentrated on capturing 802.11 Wi-Fi data from voice assistants (Google home and Amazon Echo) using them in stand-alone settings like asking general questions related to weather, jokes, facts, etc or executing commands like setting up alarm, playing music, etc. Another type of instructions is the one used to control other smart home devices like smart lights, smart plugs. While these commands/instructions were being executed by voice assistants, we sniffed traffic data passively to record the timing and size of packets for each transaction. The sniffing process is designed so as to filter data related to our devices only and avoid any noise of irrelevant devices. This is done by filtering packets based on source and destination MAC addresses and capturing only 802.11 QoS data frames.
Data Analysis
In this project, the data collection process can be divided into two parts: individual activity data and sequence activity data.
Individual Activities
- Capture data in .PCAP format
- Generate pickle files with polarity assigned
- Manually point hardware to monitor desired Wi-Fi channel
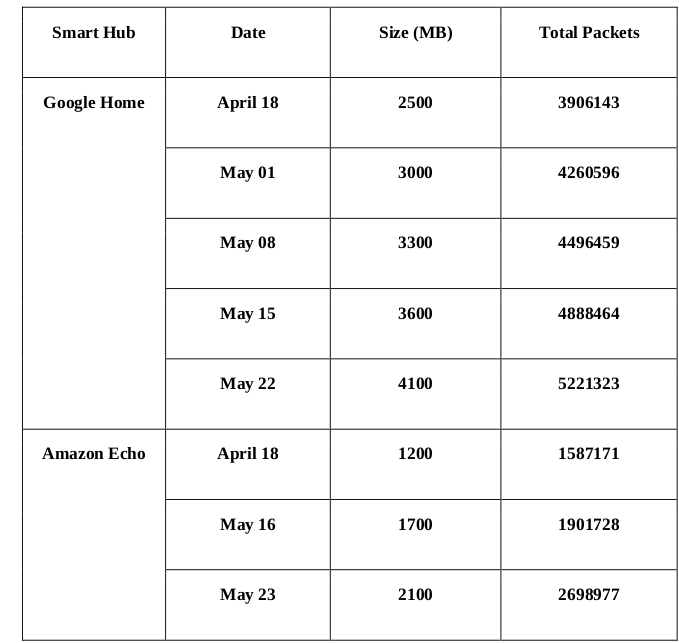
- Continue data capture across multiple weeks to observe effect of concept drift
Sequence of Activities
- Design four sequences simulating real-world scenarios
- Capture traces for 1000 iterations for each sequence
- Use multi-threading and call sub-process to ensure parallel processing
- Setup routines with voice assistants to automate sequencing
Data Analysis - Individual Activities
The characteristics of the network traces used in the experiments
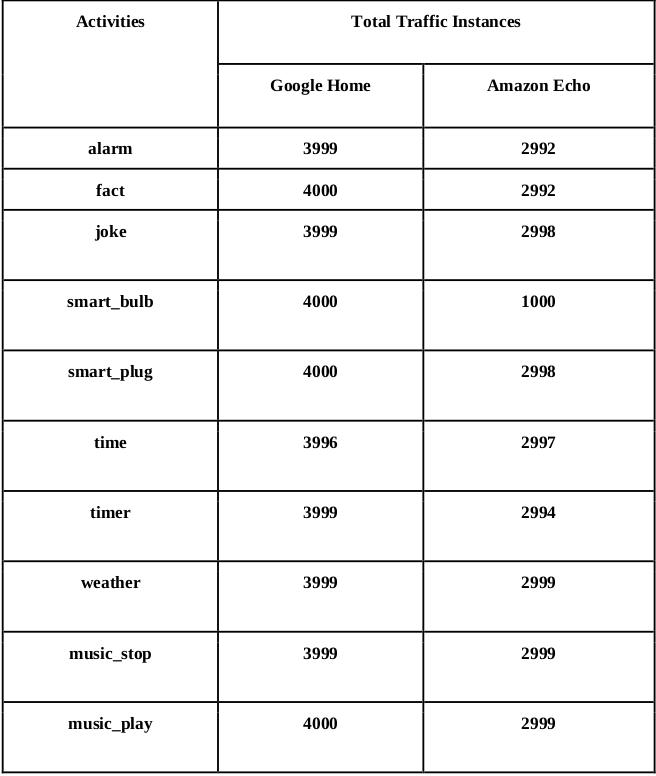
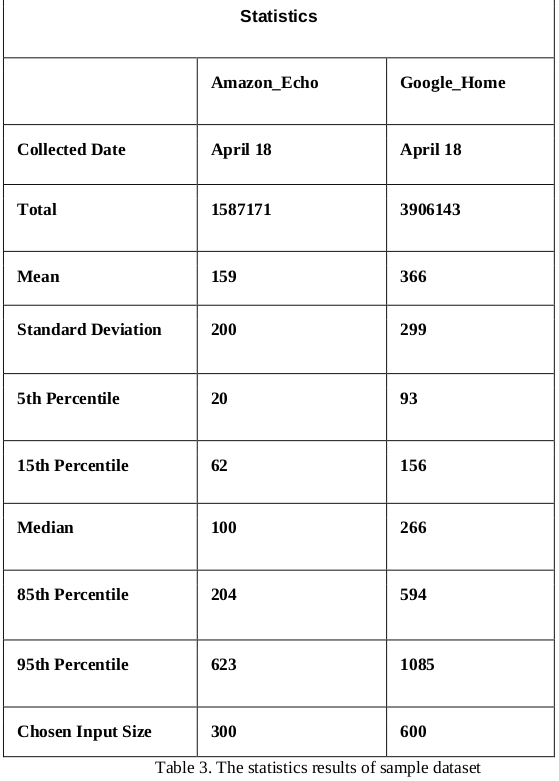
With the characteristics of the network traces used in the experiments analysed above, we need to then select packet sizes from each instance as the input vector and normalize it. This is decided by applying statistics on the data from Google Home and Amazon Echo separately, the results are presented in the table below. Here, the most important statistical results are considered as mean value and standard deviation value, as we need to make the input global size less than the sum of mean value and standard deviation value considering the data balance. Due to the space limit, we only take the data of the first week (April 18) as the sample dataset to apply such statistics. As shown in the last row of table, the chosen input size of Amazon Echo dataset is 300 while Google Home dataset is 600.
Results
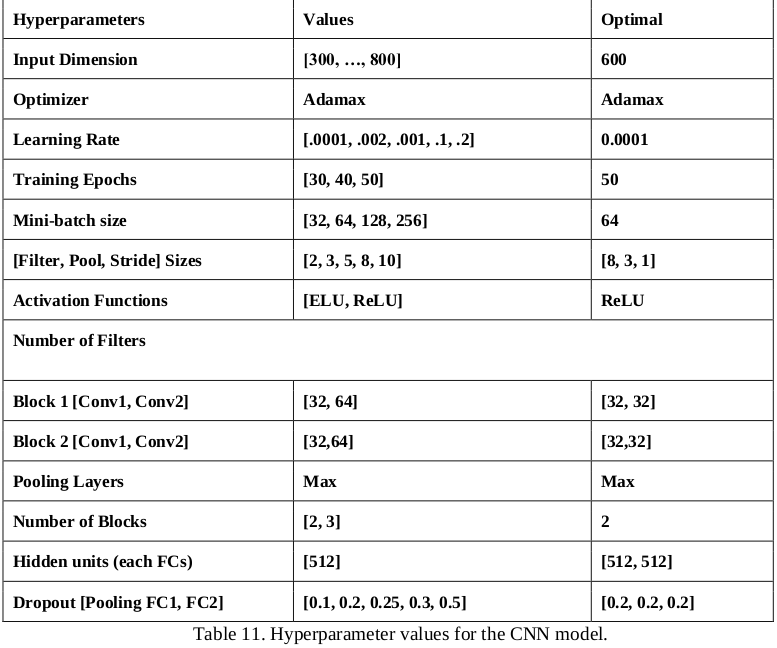
After analysing and processing captured data, we build the DF model for individual activities based on CNN model and investigate the related performance. In this section, we introduce the evaluated results from different perspectives. First, we give the overall results of our optimized model on different dataset and evaluation metrics, then we inspect the performance of hyperparameter tuning to decide the optimized model.
The hyperparameters of CNN model we used:
Evaluation - Individual Activities
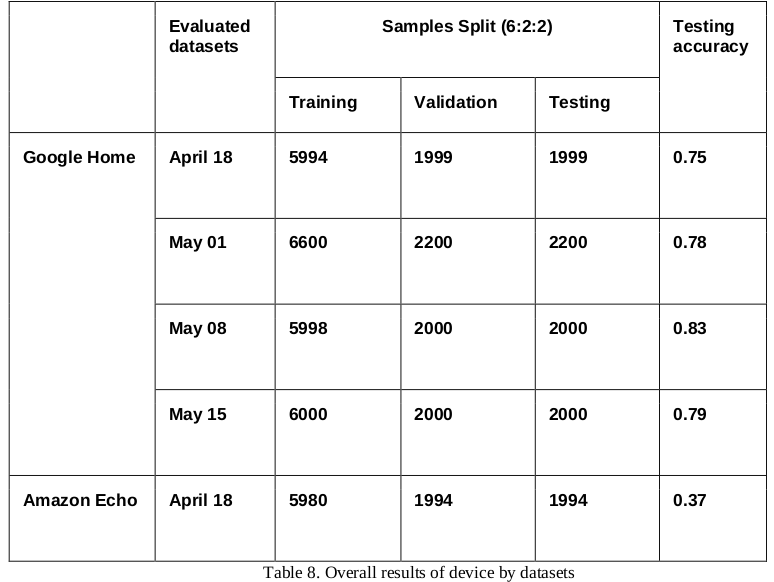
Overall Results of device by datasets
During the training process, the training set is the actual dataset that we use to train the model, in which the model sees and learns from this data. The validation dataset is used to evaluate a given model, but this is for frequent evaluation, which means the model occasionally sees this data, but never does it “Learn” from this. We usually use the validation set results to update higher level hyperparameters and plot training accuracy for further analysis. So the validation set is considered to affect a model in an indirect way. While the testing set is only used once the model is completely trained (using the train and validation sets), this is to say, the testing accuracy in the table indicates the evaluation on the testing set.
As presented in the table below. We can conclude that the optimised performance of our final model is around 83% given the testing accuracy as the evaluation metrics.
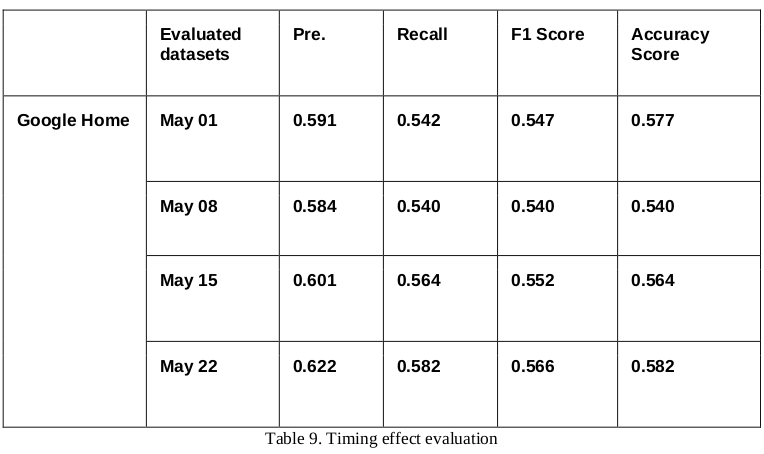
Timing effect evaluation
Also, since we collected and updated the data weekly, we would like to inspect the impact of timing on the performance. To examine this, we implement the classifier obtained from the data of the first week (April 18) to evaluate the performance on the datasets over time. Worth mentioning, as shown above the testing accuracy of Amazon Echo dataset is meaninglessly low around 37%, we exclude it here to focus more on valuable results.
The related results are presented in the table below, to give us more observation of our model, we bring in the evaluation metrics: precision, recall and F1 score. However, the conclusion can be summarised that the performance of these metrics is considerably lower than the testing accuracy. Also, we could find that the performance has slightly improved over time for most evaluation metrics.
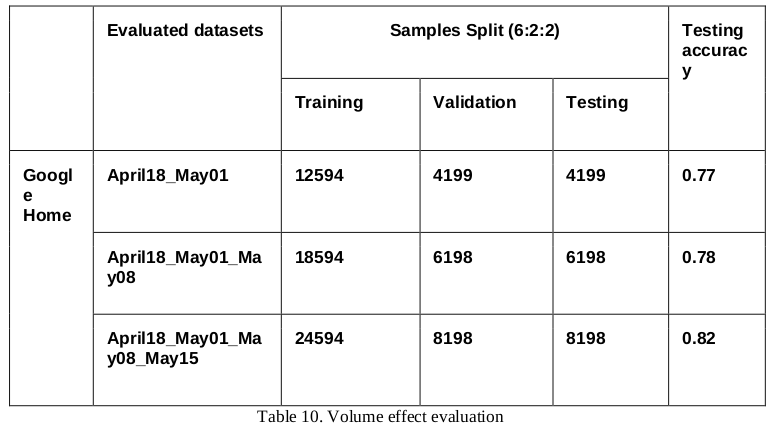
Volume effect evaluation
The volume of data is also considered to be an important influence factor for performance. To examine this, we implement the classifier obtained from different volumes of datasets to evaluate the performance. Due to technical issues, the data of Amazon Echo dataset is incomplete for all 10 activities, so it is excluded here. As shown in the table below, we increase the volume of data by merging several datasets together, for example, dataset April18_May01 means the combination of dataset April18 and dataset May01. The dataset split for testing is same as described before, it is indicated that the performance is slightly improved with the increasing volume of data.
Limitations And Future Work
Lack of time to model sequence activities. Though we designed the experiments to collect sequence activity data, we only managed to analyze the data by plotting the IO graphs due to the time limit of this project. While the initial vision is to first extract the correlated timing features to be used to model sequence activities, and this could be the future research direction.
Overfitting problem in our developed model. The performance of classifying individual activities still has a lot of space to improve as we have already discussed above, solving overfitting would be the key task in the future.
Incomplete data due to technical issues. Due to technical issues and device usage conflicts, the amount of data for Amazon Echo is incomplete and much less than Google home. And somehow this influences the later performance of classification.
Lack of relevant literature to set hyperparameters in the CNN model. A lack of relevant literature from similar projects enabled several tasks to perform different tests using different parameters. In that way, we could compare results and decide which optimal values could deal with the overfitting and keep a good accuracy. Fortunately, an initial CNN model was shared by the client, then some parameters were taken as a reference to be improved according to the captured IoT wireless data for the current project.
To summarize, for future work, we are planning to model the sequence activities data using the machine learning models that advantage in time series data. Also, we aim to increase the generalizability of the classifier by collecting data under different networks and in different time frames. We will also investigate the limits of the current CNN model in terms of hyperparameter tuning.